


Perform with FCC S.A.
Join our Content Team to create and share knowledge.
Learn how to be part of it


Be acquainted with our purpose, values, history and all that makes the FCC S.A. essence

A portfolio of products and solutions plenty of innovation, technology and sustainability.

To deliver products with leading edge technology and global quality is just our starting point. That is why we have a series of exclusive services for our customers and that make all the difference on a daily basis.

See in practical terms how innovation is present in the FCC S.A. DNA

Sustainability is present in every solution, delivery and process of our company: learn more.

We are made of synergy! Learn how you can become a FCC S.A. supplier

Learn how it is to work with FCC.S.A. Learn our culture, programs and check for opportunities.

Integrity and transparency are part of what we are. Check our annual reports and see the result of our work.

Find a variety of contents that permeate our businesses and see how you can be a part of what we create around here.

Together, we create more! Be a FCC S.A. partner and generate value for a world in transformation: learn how.

INTRODUÇÃO
Particulate materials’ granulometry is a measure of the size of the particles that are present in a sample. In an industrial process, knowing this feature is crucial to predict the particles’ behavior and for obtaining diagnostics of the process operating mode. Specifically, for fluid catalytic cracking units (FCCU), knowing the catalyst’s granulometry enables monitoring the efficiency of cyclones in the separation stages, fluidization properties and possible unit losses.
The impacts resulting from the rise in fines losses in a FCCU can encompass fluidization and catalyst circulation problems, change in yields profile, increased cost associated with catalyst make-up, environmental impact from higher particulate emission from the stack, among others that will be considered in this paper.
For an FCC unit to operate under optimum conditions, it is crucial to secure suitable catalyst fluidization and circulation in the converter, both directly dependent from granulometry. The right fluidization makes possible the adequate contact between catalyst particles and the gaseous phase, required for cracking and combustion reactions, and promotes a good catalyst circulation. Circulation determines the catalyst/oil ratio for each operating scenario, being associated with the unit’s pressure and energy balances. Additionally, the cyclone’s separation efficiency is related to particles’ features, such as granulometric profile.
Some reduced particulate loss during cyclones’ normal operation is acceptable. It can be temporarily intensified during fresh catalyst dosage. However, in case cyclones loose efficiency and cannot adequately retain the expected amount of catalyst, the particulate excess transferred to downstream systems can result in serious emission issues, operational difficulties, deposition and reduction of equipment’s lifespan, and even cause a non-scheduled unit outage.
Granulometry follow-up enables identification of possible cyclone inefficiencies and other operational issues. Such diagnostics allow operational adjustments to minimize catalyst losses or improve fluidization, as well as assertively planning any converter maintenances.
The most common method for determining particle size distribution (PSD) of FCCU catalyst samples is laser diffraction, which consists in the formation of a dispersion pattern as light interacts with the sample. Parameters such as intensity and angle of the beam are registered and related to particle size.
The main goals in following-up PSD consist in monitoring cyclones efficiency, equilibrium catalyst (e-cat) fluidization properties and possible FCCU losses.
A few indicatives of abnormal catalyst loss are:
Pronounced catalyst loss may occur due to different circumstances: project issues, cyclone failure, mechanical problems (erosion, cracks, etc.), operation out of the recommended range (such as surface velocity in the vessel interior and loss of level), and further, catalyst rupture due to low mechanical resistance or excessive velocity at the vapor and air outlets. There is a huge incidence of drawbacks associated with cyclones such as: hole, refractory failure, valve blockage, dipleg, coke formation and drag by innadequate operation conditions.
Some information is crucial for the diagnostics of this kind of problem. The unit’s balance of losses should be examined based on the quantification of the catalyst outlet streams through the regenerator and reactor sides. It is fundamental to know the particle’s characteristics such as granulometry, attrition index and bulk density, besides the unit project and operational variables such as flow rate, pressure, vapor, air flow, among others.
In addition to the size profile, the outer catalyst morphology is also an important factor that impacts the unit’s circulation and fluidization. The presence of contaminants in the feed, such as iron and calcium can cause nodules on the particles, increasing their flow resistance, in addition to the vitrification risk, which reduces its accessibility, as can be observed in Figure 1.
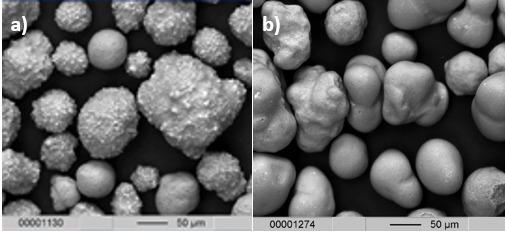
Figure 1. Effect of iron on the outer catalyst morphology: (a) nodules on the particle surface, and (b) vitrified effect. Source: FCC S.A. Database.
The e-cat granulometric profile is influenced by the characteristics of the fresh catalyst, by the hardware and by the unit operational condition. Losses are expected when fresh catalyst is dosed, due to the presence of fines which are not retained by the cyclones, and to the polishing of particles’s surface irregularities when exposed to an abrasive condition (intrinsic to the process). Whenever the fraction of particles in the range of 0 mm – 40 mm, and when the same range is reduced, it can indicate that the cyclones have lost efficiency. These changes are also observed in the average particle size (APS), which increases when fines are reduced and decreases when fines increase, as illustrated in Figure 2.
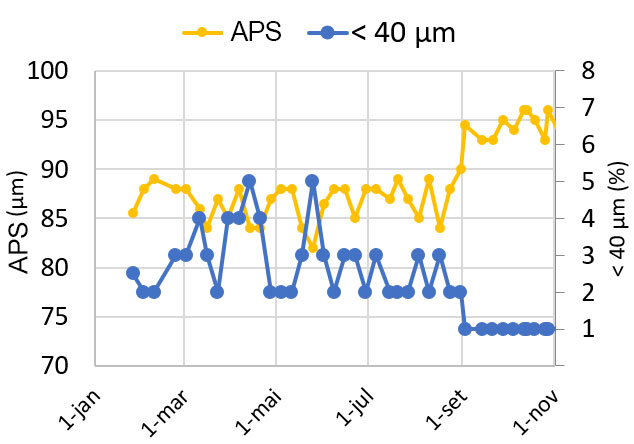
Figure 2. APS and < 40 mm fraction evolution for an FCC unit e-cat. Source: FCC S.A. Database.
Data for fines granulometry is normally presented as normal distribution plots, such as illustrated in Figure 3. In an accumulated distribution plot, it is considered that the cyclones show good efficiency when the recovery percentage of particle size < 35 mm is ³ 70%. On the other hand, for the standard distribution plot, the following associations are usually made based on peak ranges:
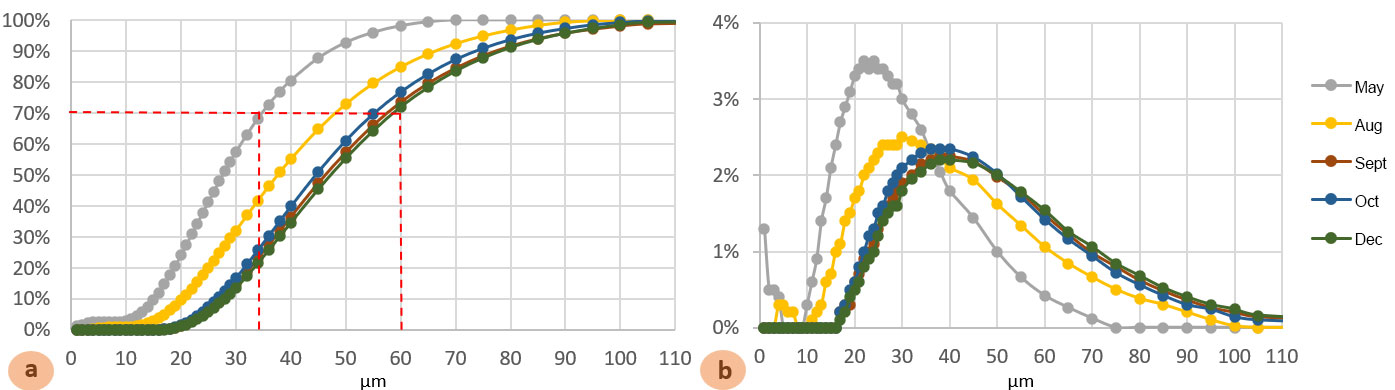
Figure 3. Accumulated (a), and (b) standard normal distribution curves for third stage cyclones (TSC) fines with increased losses since the 2nd semester. Source: FCC S.A. Database.
The granulometry analysis result can also be evaluated as a bar plot segmented by particle size interval. This format makes the identification of changes in different ranges easier and enables the comparison with literature reference profiles, which suggest loss diagnostics associated with profile changes. Figure 4 shows the e-cat and fines profiles for units with normal operation (which varies significantly depending on the project and revamps), damaged or flooded cyclones, damaged plenum and high attrition.
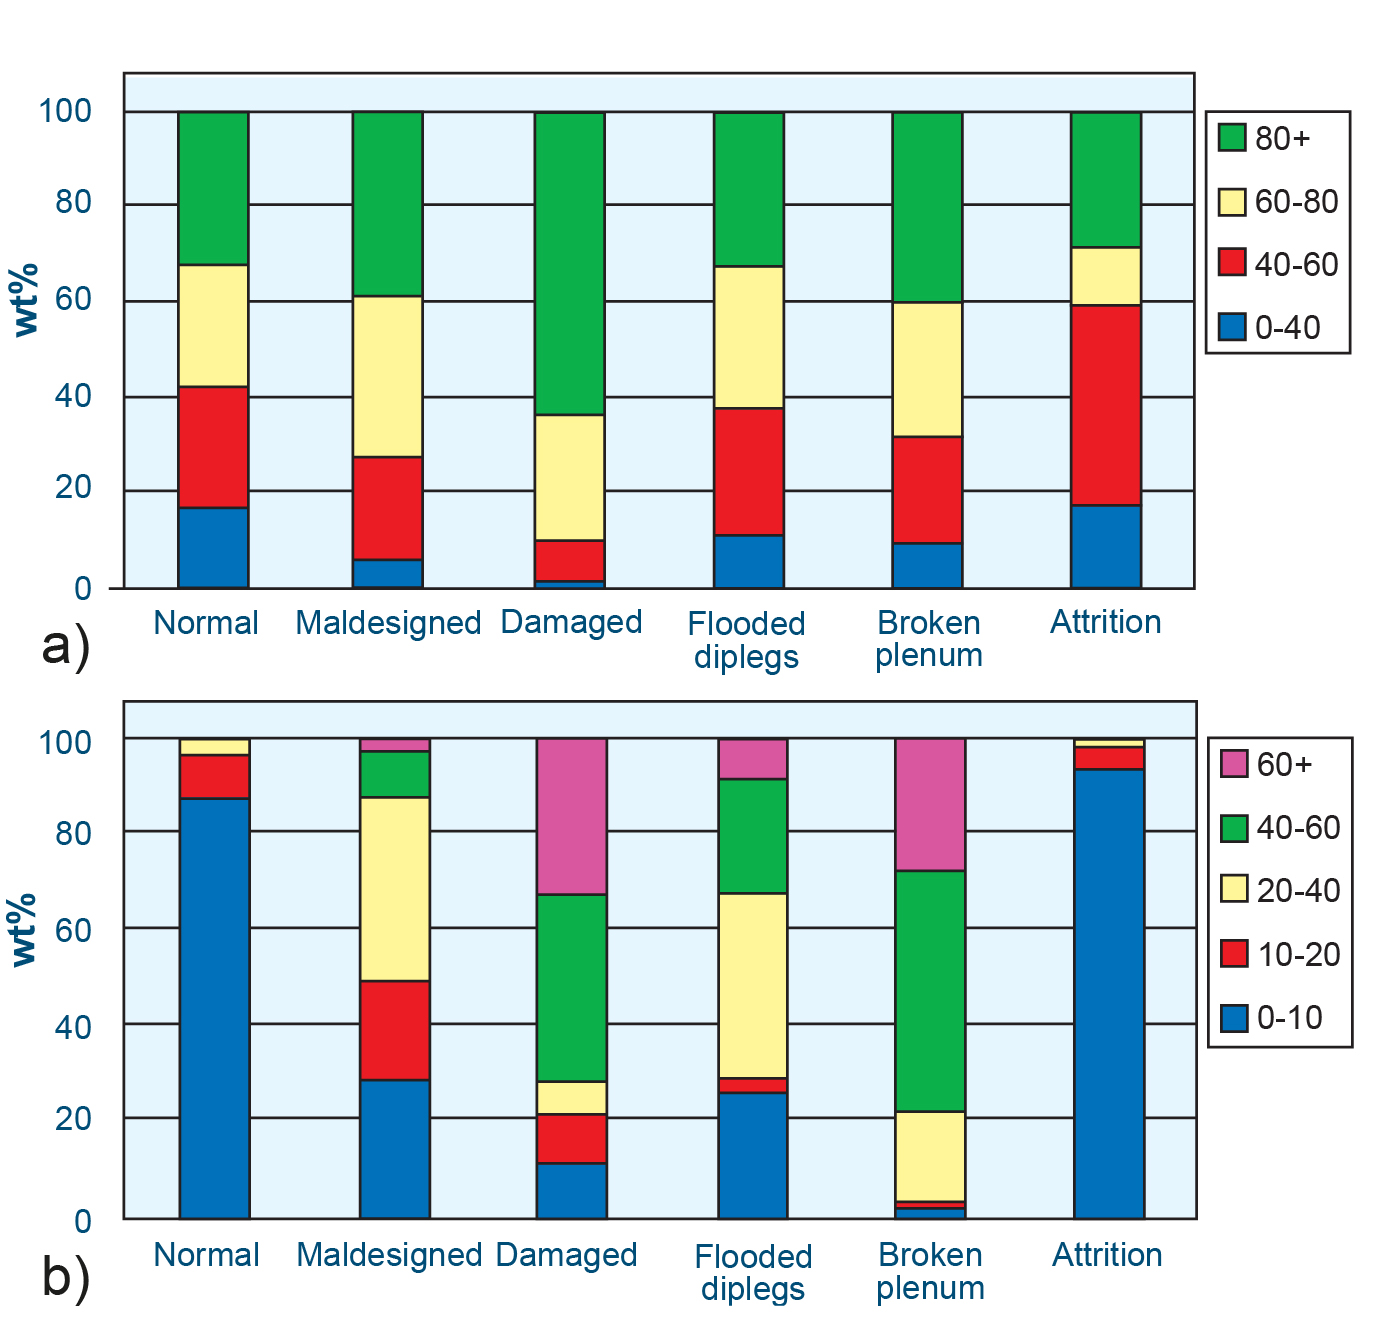
Figure 4. Expected granulometric distribution in an FCC unit for a) e-cat and b) fines. Source: Diagnosing catalyst losses, Jack Wilcox (Albemarle)
The e-cat and fines sampling frequency should be sufficient for providing effective unit follow-up. Ideally, it should be done once a week for e-cat, once a month for TSS (third stage separators) fines, ESP (electrostatic precipitator) and WGS (Wet Gas Scrubber), once in a trimester for slurry fines (also called slurry ashes) and whenever possible for the stack. In case of issues with catalyst losses, sampling frequency can be increased.
Granulometry follow-up is crucial for problems detection and solution, as well as for a reference record formation. Detecting suspected losses as early as possible enables quick implementation of contention measures, reinforcing the importance of sampling. This includes not only e-cat, but also fines, both on the side of the reactor/separator, and the regenerator.
Analysis of these samples are available in FCC S.A’s laboratories. The company relies on a multidisciplinary technical staff available for aiding in the evaluation and optimization of its customers’ units.
Related Publications


What did you make of the publication?